
STAR Housing Stats | April 2026
Published May 29, 2026 | Maggie McAbier, STAR Communications & Education Administrator
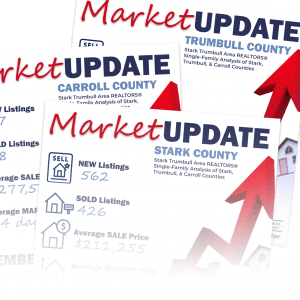
The STAR April Housing STATS are now available for you to review and/or share. The images below represent a Single-Family & Town Home Listing Analysis of Stark, Trumbull, & Carroll Counties.
According to the April Monthly Indicator Report published by MLS Now, May 29, 2026.
"U.S. existing-home sales fell 3.6% month-over-month and 1.0% year-overyear to a seasonally adjusted annual rate of 3.98 million, according to the National Association of REALTORS® (NAR), as tight supply and ongoing affordability challenges constrained activity. Sales declined month overmonth in all four regions. Year-over-year, sales increased in the South and West but fell in the Midwest and Northeast.
New Listings increased 6.5 percent for Single Family homes and 12.5 percent for Townhouse/Condo homes. Pending Sales decreased 12.9 percent for Single Family homes but increased 21.4 percent for Townhouse/Condo homes. Inventory increased 15.2 percent for Single Family homes but decreased 15.6 percent for Townhouse/Condo homes.
Median Sales Price increased 6.8 percent to $206,600 for Single Family homes but decreased 1.3 percent to $231,938 for Townhouse/Condo homes. Days on Market decreased 9.3 percent for Single Family homes and 29.8 percent for Townhouse/Condo homes. Months Supply of Inventory increased 11.8 percent for Single Family homes but decreased 20.0 percent for Townhouse/Condo homes.
Nationally, the median existing-home price rose 1.4% from a year earlier to $408,800, marking the 33rd consecutive month of year-over-year price increases as limited inventory continued to put upward pressure on prices, NAR said. There were 1.36 million homes for sale heading into April, up 2.3% from a year earlier, representing a 4.1-month supply at the current sales pace." CLICK HERE to download the complete Monthly Indicator Report
Quick Facts
Residential activity in Carroll, Stark, and Trumbull counties combined composed of single family and townhouse/condo properties. Percent changes are calculated using rounded figures. Comparison April 2025 vs. April 2026.
| + 8.1 % | + 5.1 % | + 12.5 % |
| Change in Closed Sales All Properties |
Change in Median Sales Price All Properties |
Change in Homes for Sale All Properties |
These statistics are sourced from MLS Now and were current as of May 29, 2026. They are deemed accurate, but not guaranteed.
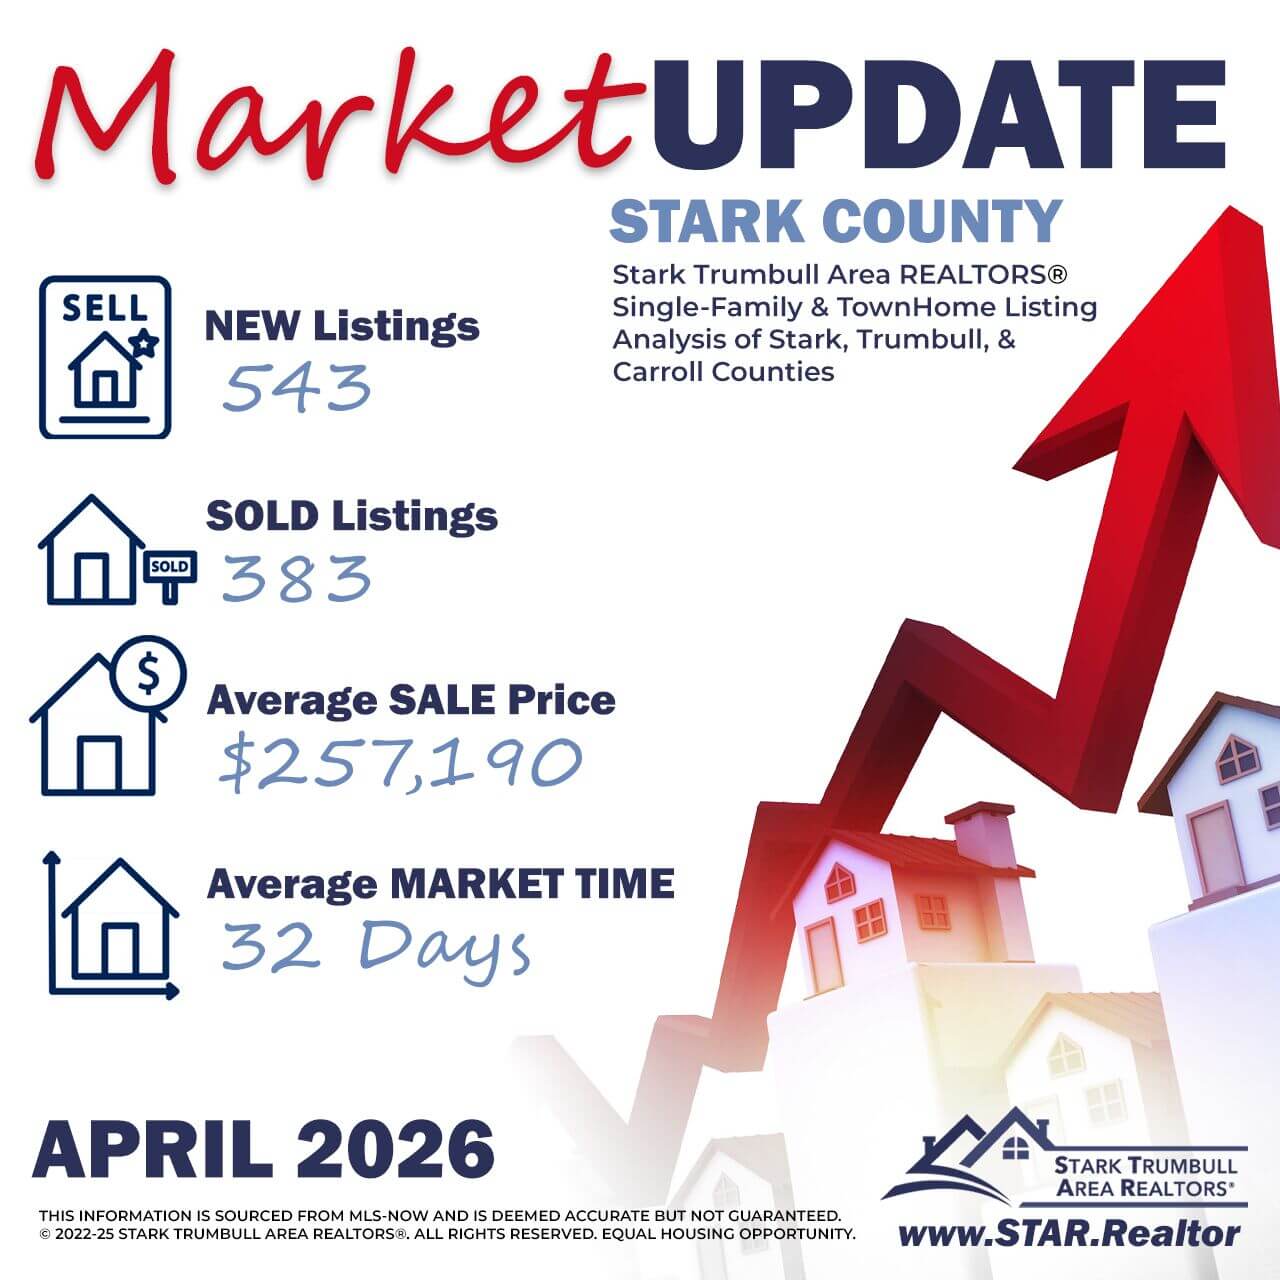
STARK County Stats Sharable
CLICK HERE to download file
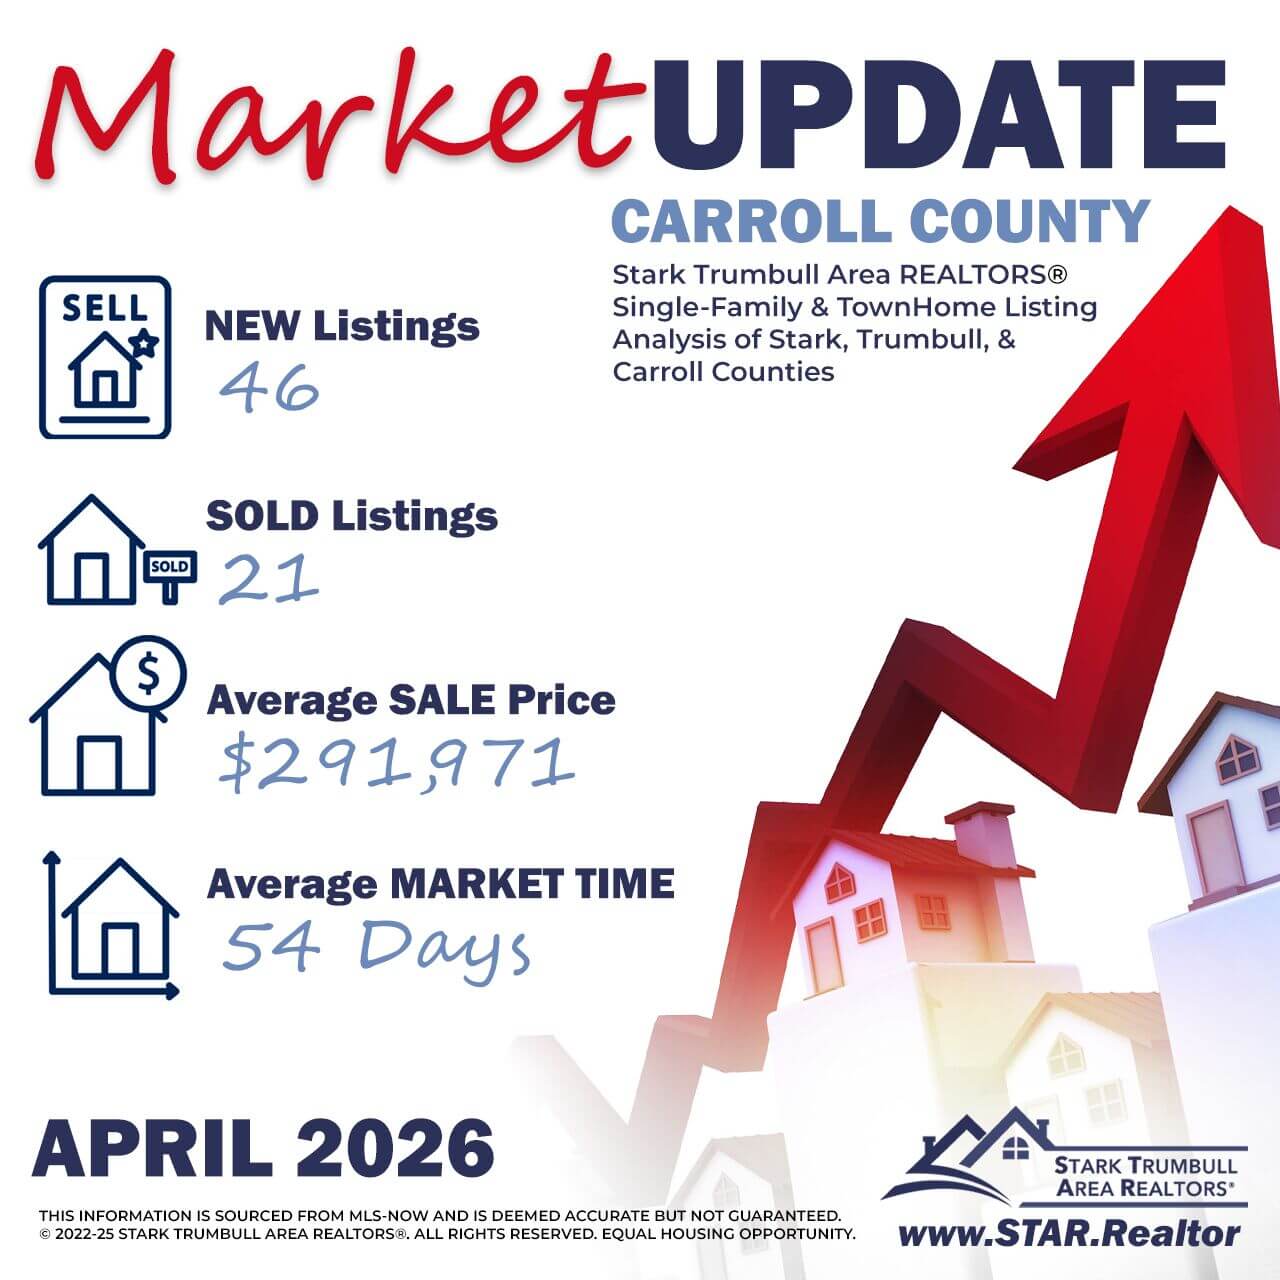
CARROLL County Stats Sharable
CLICK HERE to download file
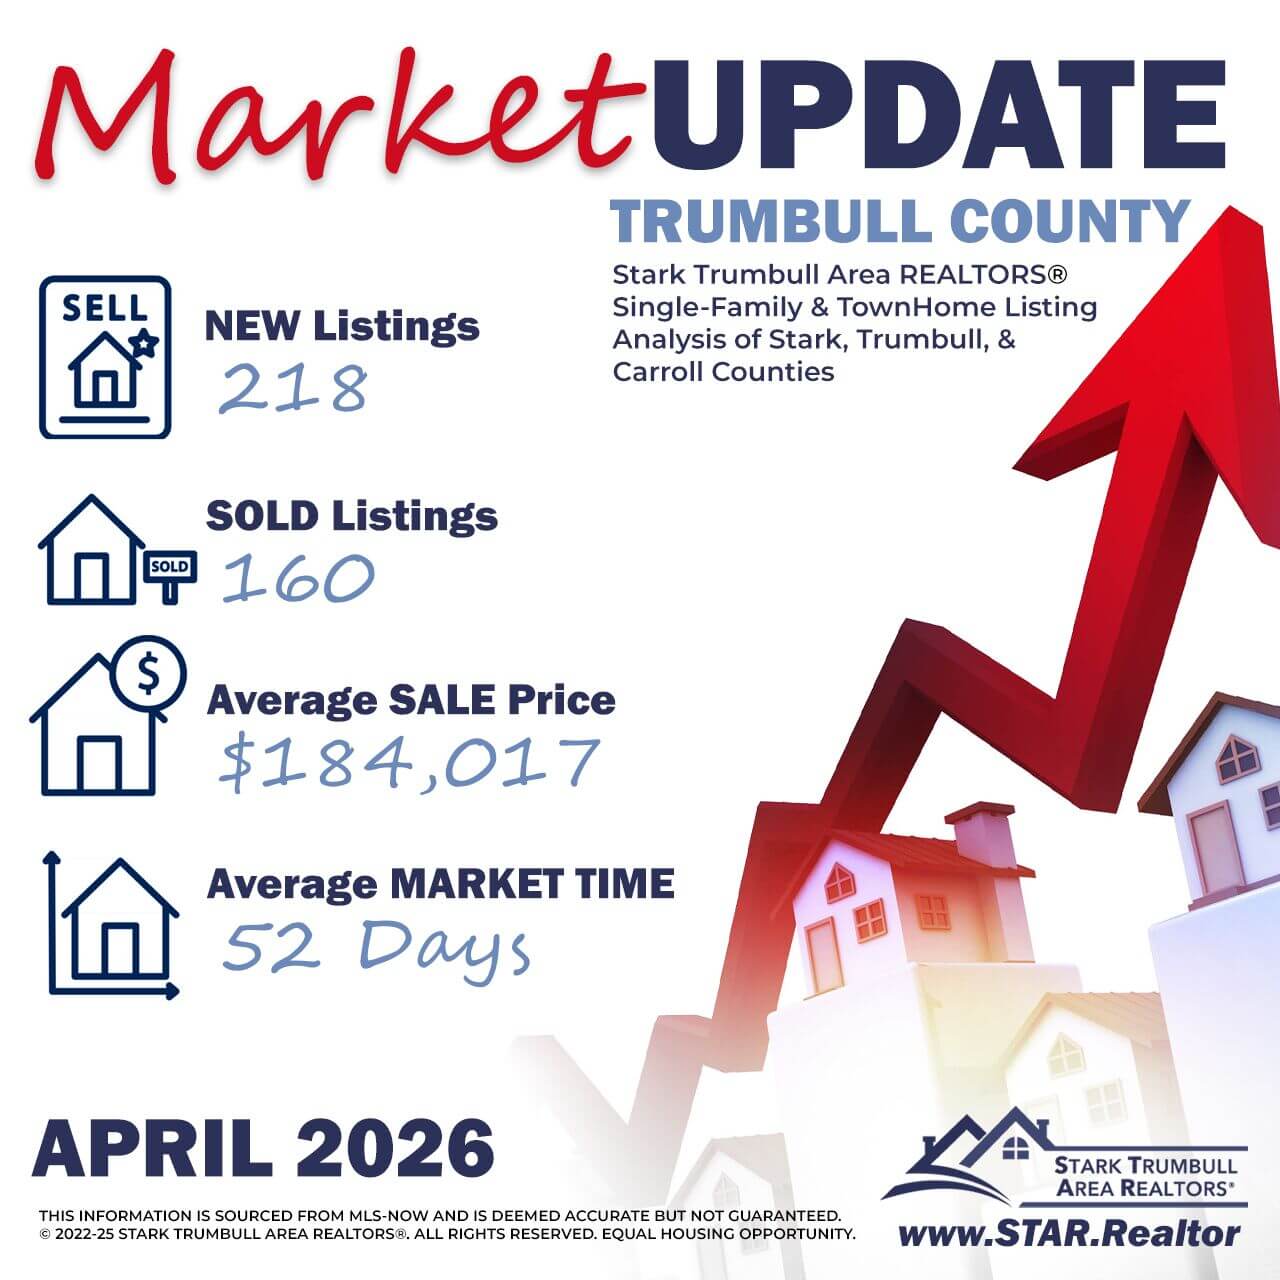
TRUMBULL County Stats Sharable
CLICK HERE to download file