STAR Housing STATS | September 2022

The STAR Sept 2022 Stats are now available for you to review and/or share. The images below represent a Single-Family & TownHome Listing Analysis of Stark, Trumbull, & Carroll Counties.
Quick Facts
Residential activity in Carroll, Stark, and Trumbull counties composed of single family and townhouse/condo properties. Percent changes are calculated using rounded figures. Comparison September 2021 vs. September 2022.
| - 11.1% | + 7.9% | - 9.4% |
| Change in Closed Sales All Properties |
Change in Median Sales Price All Properties |
Change in Homes for Sale All Properties |
These statistics are sourced from MLS Now and were current as of October 11, 2022. They are deemed accurate, but not guaranteed.

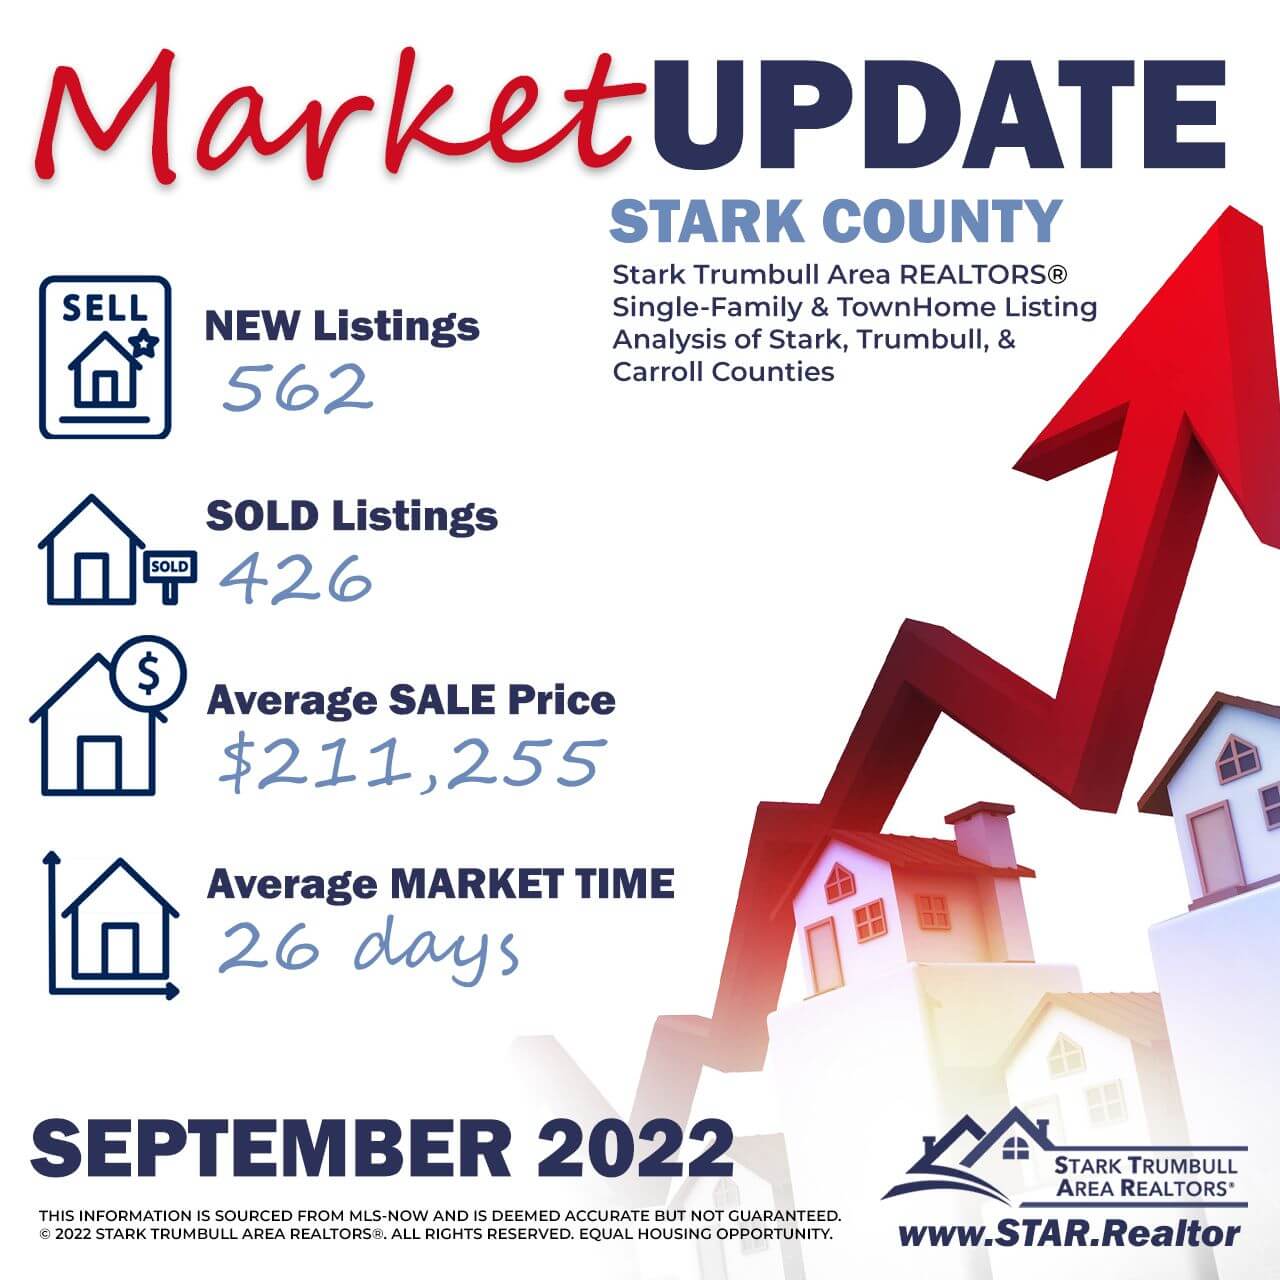
STARK County Stats Sharable
CLICK HERE to download .png file

CARROLL County Stats Sharable
CLICK HERE to download .png file

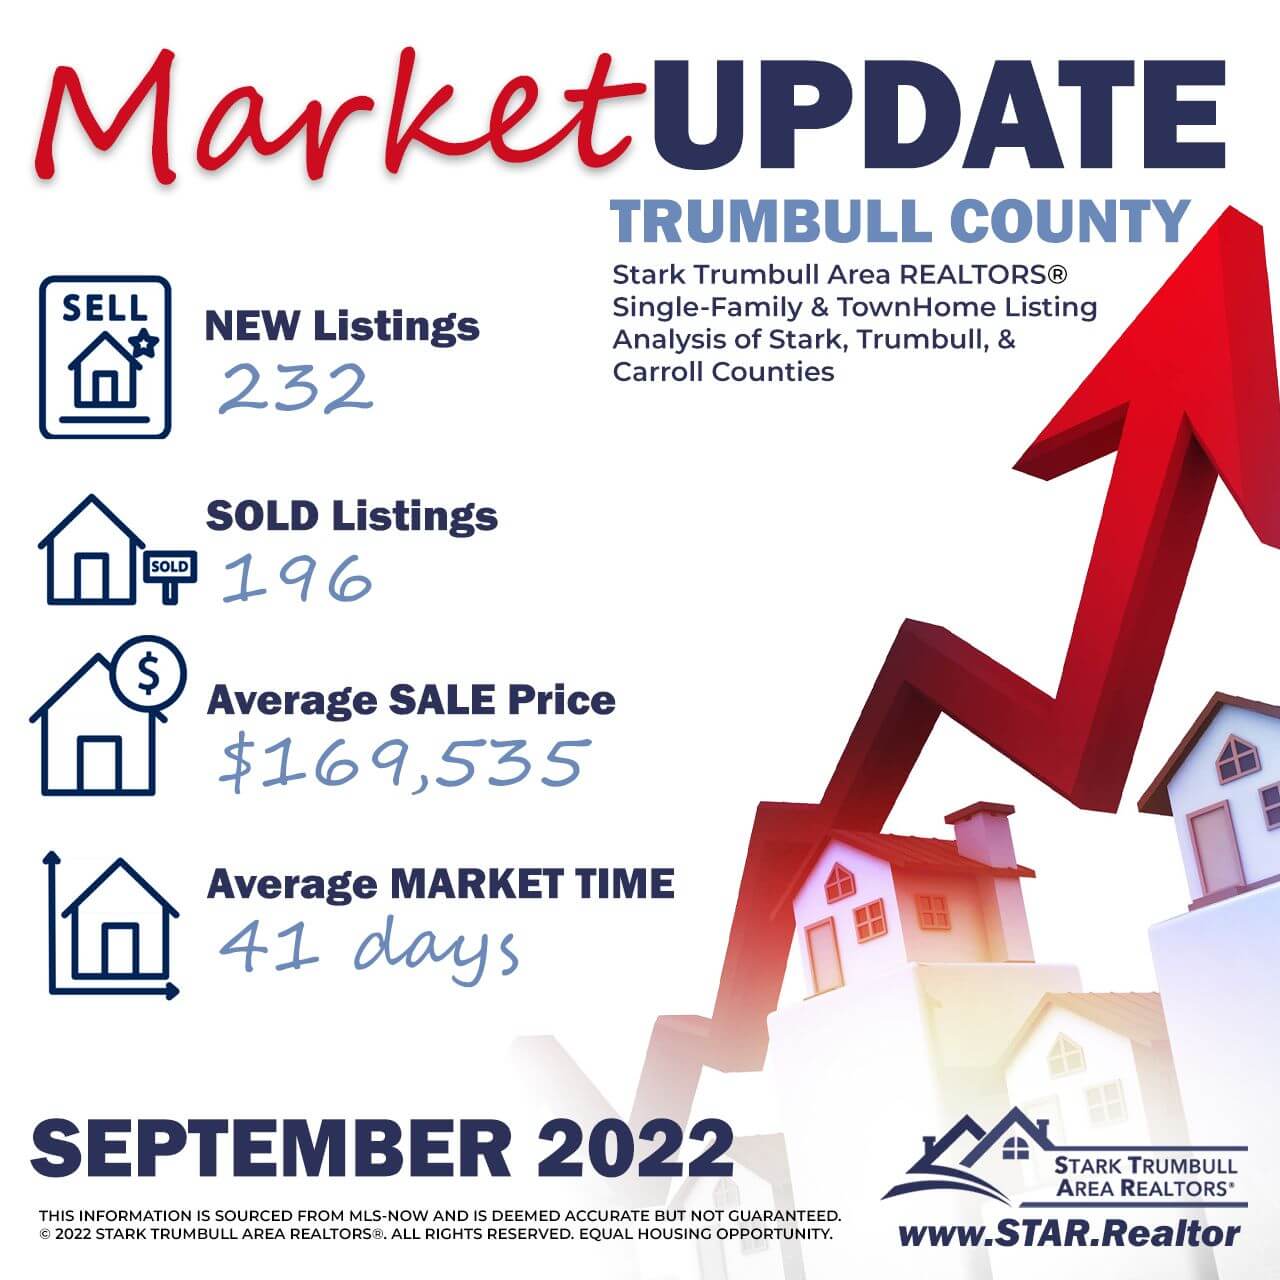
TRUMBULL County Stats Sharable
CLICK HERE to download .png file